In this post I am going to describe how to create a report with Sparklines using an MDX query. In my current role I do a lot of Proof Of Concept pre-sales work for different industries, and I’ve really grown to love sparklines. I think they are fantastic in giving users an understanding of how an object is tracking over time in a single glance.
Creating a report with sparklines is relatively straight forward using T-SQL, and there are blogs out there that show how to do this. I’ve also seen blogs demonstrating how to create a sparkline using MDX but they seem to me to be too simplistic and don’t include a dynamic date parameter. So that’s what I want to cover here, based on a transaction fact table.
When creating the report, we want to capture data for each month prior to the date selected, including the sum of all values for the month of the date selected, up to and including the selected date.
So for example, if I were to choose September 19, 2007, I would want to see 9 data bars, with the 9th data bar representing the sum of data from Sep 1st to Sep 19th.
We are going to use the Date Picker to select our date. To start with, we need to modify the date dimension DimDate in AdventureWorks2008R2. Run the following SQL:
ALTER TABLE dbo.DimDate
ADD YearMonth as
CAST(CONVERT(CHAR(6),FullDateAlternateKey,112) AS INT)
Then add YearMonth to your AdventureWorks2008R2 Date dimension and reprocess the dimension and cube. Alternatively you could simply add the MonthNumberOfYear column to the Date dimension, but I find the YearMonth attribute quite useful. This will give us an ordered month number that we can use in our sparklines.The MDX query we will use for our report is:
SELECT [Measures].[Internet Sales Amount] ON 0,
NON EMPTY{
PeriodsToDate(
      [Date].[Calendar].[Calendar Year]
, [Date].[Calendar].[Date].&[20070919].parent.lag(1)
      ) +
MTD([Date].[Calendar].[Date].&[20070919]
)}
*[Date].[Year Month].[Year Month]
*[Product].[Subcategory].[Subcategory] ON 1
FROM [Adventure Works]
Let’s take a look at this. The first part of the Row(1) axis with the PeriodToDate statement returns us the sum of months for all months prior to the date we’ve selected for that year.
We then use MTD to return us the sum of all values for the month of the date selected, up to and including the selected date. We do a cross join to return the product subcategory, and another to return the YearMonth value that we will be using in our Sparkline.
I’ve modified the query to show only Mountain Bikes to make it easier to understand what is being returned:
So let’s create a dataset called dsMain within SSRS, paste our MDX query and close the data set. We then open the toolbox and drag the Sparkline onto the report. We will select
Column as the Sparkline Type for this report.
Double click on the sparkline and add Internet Sales Amount to Values, and YearMonth to Category Groups.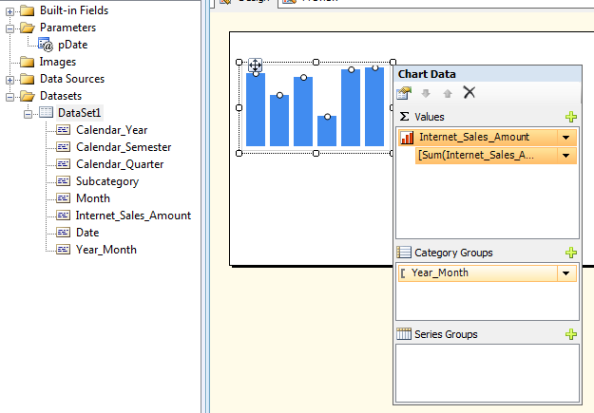
Now drag a table onto the report. Add Subcategory to the first column and internet sales to the second column. Right click on the Internet Sales and select Expression. Change the expression to: =Last(Fields!Internet_Sales_Amount.Value)
Click OK. This will return us the last values from our dataset for each subcategory, in this case the values of the date we’ve selected.
Now go down to Row Groups at the bottom of the screen, right click, select Group Properties and add Subcategory as a Group. 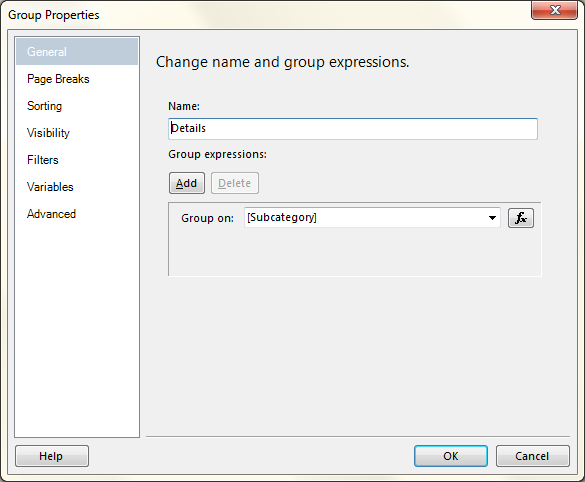
Drag the sparkline object into the second row of the third column. If we run the report we will see the following:

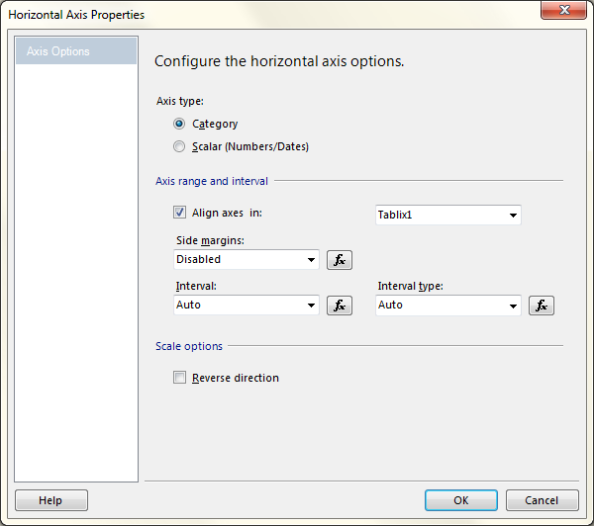
The three large blocks in the sparkline object of the majority of the subcategories are ugly and I don’t believe are helpful in understanding the data. Right click on the Sparkline object, select Horizontal Axis Properties and click on “Align axis in:” and select “Tablix1”.
Now let’s take a look at the report in Preview:
 We can now see that for the majority of the subcategories, the three data bars in the sparkline represent the last three months (including the current selected month).
We’re nearly finished. I’m going to add the DatePicker for our Date Parameter to make the report dynamic.
For more information on this, see: https://jsimonbi.wordpress.com/2011/03/22/using-the-datepicker-in-ssrs-with-mdx/
We first set up the Date parameter by adding a parameter that we will call pDate. We change the data type to Date/Time, and leave all other tabs with the default settings.

Then open the dataset dsMain and click on Query. Select Query Parameters and set the default date e.g: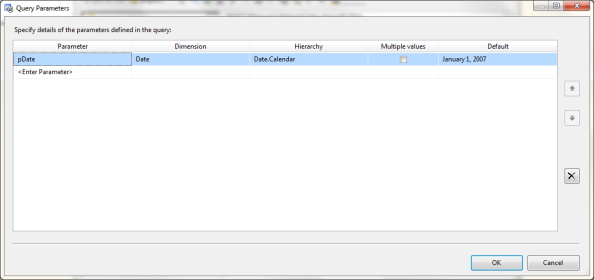
Now modify the query to include the date parameter:
SELECT [Measures].[Internet Sales Amount] ON 0,
NON EMPTY{
PERIODSTODATE(
      [Date].[Calendar].[Calendar Year],
STRTOMEMBER(@pDate, CONSTRAINED).PARENT.LAG(1)
      ) +
MTD(STRTOMEMBER(@pDate, CONSTRAINED)
)}
*[Date].[Year Month].[Year Month]
*[Product].[Subcategory].[Subcategory] ON 1
FROM [Adventure Works]
We now need to click on the parameters tab, select Expression and change to:
=”[Date].[Calendar].[Date].&[” & Format(CDate(Parameters!pDate.Value),”yyyyMMdd”) + “]”
Close the dataset properties window.
Just as in the previous post we want to display the Date parameter in the report. To do that we need to format the DatePicker result. We drag the pDate parameter onto the report, and edit the expression. Set the expression to = Format(Parameters!pDate.Value, “dd MMMM yyyy”)
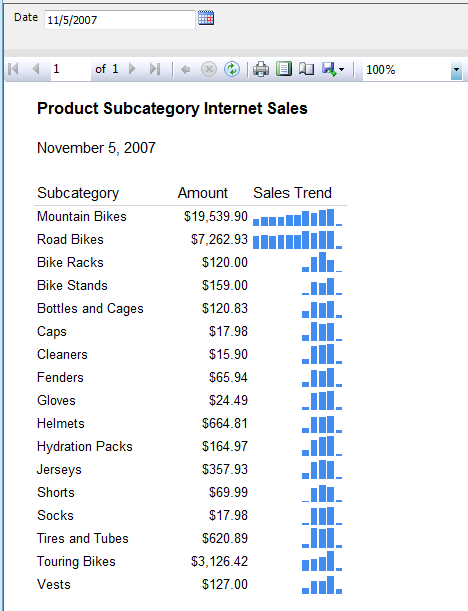
We can now run the report and see the final results. I’ve made some cosmetic changes to the report for improved readability.
For the final example I will change the date selected to November 5th, 2007.
Jen Stirrup
March 28, 2011
Rob Farley has written a useful piece on InScope, and how it can further assist with Scope in SSRS http://goo.gl/LhjZB
Thank you, John, for your comments on my blog recently. In case you are interested, I have gone into some more detail from the SSRS and data visualisation perspective rather than the MDX perspective. This includes some thoughts on the vertical axis as well, using a different example: http://goo.gl/3ppjs
jsimonbi
March 28, 2011
Thanks Jen.
Good point on using Align with Vertical Axis.
sudhirsvs
May 13, 2011
Thanks great work
Ron T
June 29, 2012
Thanks simon for post. something more is here
Ron Timon